IELTS Writing Task 1: Luyện tập cách viết dạng Line Graph
Line Graph - biểu đồ đường là một trong những dạng biểu đồ thường gặp trong IELTS Writing Task 1. Hôm nay chúng ta cùng luyện tập cách viết biểu đồ này nhé!
Bạn cần xem hết video dưới đây và chuẩn bị bút giấy để ghi chú học hiệu quả nha.
⇒ Để xem cách làm các dạng bài khác, bạn click xem tại: Hướng dẫn viết Writing Task 1 chi tiết
Cách viết Writing Task 1 Line Graph
Chúng ta cùng học thông qua video hướng dẫn để hiểu rõ về dạng bài Linegraph đồng thời mở rộng kiến thức, sau đó luyện viết theo hướng dẫn video tiếp theo bên dưới nhé.
Thông tin cơ bản chung
Line Graph là dạng biểu đồ với các đường nối các điểm dữ liệu theo thời gian để thể hiện sự thay đổi hoặc xu hướng của một hoặc nhiều đối tượng. Mỗi đường sẽ thể hiện một đối tượng và có sự thay đổi theo thời gian (năm, tháng, quý, v.v.). Do đó khi phân tích biểu đồ cần chú ý đến mốc thời gian.
Cần chú ý với biểu đồ đường:
- Mỗi đường trên biểu đồ đại diện cho một đối tượng/danh mục (ví dụ: quốc gia, sản phẩm, nhóm tuổi…)
- Trục hoành (X-axis) thường thể hiện thời gian
- Trục tung (Y-axis) thường thể hiện giá trị như số lượng, %, tỷ lệ, v.v.
Các loại biểu đồ đường:
Biểu đồ 2 đường
Thường ít xuất hiện trong đề nhưng được chia riêng là một dạng để người học dễ phân tích hơn. Biểu đồ này sẽ chỉ cần người làm so sánh 2 đường theo thời gian để phân tích xu hướng tăng/giảm/đứng yên/dao động của các đối tượng.
Biểu đồ từ 3 đường trở lên
Dạng này thường phổ biến hơn và có yêu cầu so sánh nhiều đường hơn - thường là 4 đường.
Lưu ý:
- Đọc biểu đồ đường từ trái sang phải theo trục thời gian để phân tích sự thay đổi, xu hướng của đường.
- Cần phân tích kỹ, viết bài theo ý kiến nhận xét khách quan với tiêu chí khoảng 150 chữ, làm trong khoảng 20 phút để dành cho Task 2.
- Chú ý sử dụng các từ ngữ, cấu trúc thể hiện xu hướng phù hợp, chọn lọc thông tin đưa vào bài, đừng đưa mọi số liệu có trong biểu đồ mà chọn ý chính thôi, tránh lan man.
Dưới đây chúng ta cùng làm quen Line Graph cùng từ vựng, cấu trúc cũng như các bước viết bài, luyện tập phân tích dạng bài này nhé.
Từ vựng, cấu trúc cơ bản
Đối với biểu đồ đường, các từ vựng, cấu trúc dưới đây sẽ giúp bạn mô tả, phân tích được tốt hơn.
Language for describing trends
Dưới đây là tổng hợp các từ vựng hay dùng để diễn tả xu hướng cho biểu đồ đường, bạn cùng lưu về nhé.
| Xu hướng (Trend) | Động từ (Verb) | Danh từ (Noun) | Nghĩa | Note |
| Xu hướng tăng | increase | increase | tăng, gia tăng | động từ hoặc danh từ (an increase = sự tăng) |
| rise | rise | tăng, sự tăng | cũng dùng được như danh từ (a rise = sự tăng) | |
| grow | growth | phát triển, tăng trưởng | thường dùng cho quá trình lớn dần, phát triển | |
| go up | upward trend | đi lên, tăng lên | cách nói thường ngày, không trang trọng bằng “increase” | |
| climb | climb | leo lên, tăng dần | nhấn mạnh sự đi lên theo kiểu “leo dốc”, dùng miêu tả tăng từ từ hoặc liên tục | |
| Xu hướng tăng mạnh | rocket | rocket | tăng mạnh, vọt lên nhanh chóng | Chỉ sự tăng trưởng rất nhanh |
| soar | soar | vươn lên, tăng mạnh. | Thể hiện việc tăng trưởng mạnh mẽ | |
| leap | leap | nhảy, vượt qua, sự nhảy vọt. | Tăng trưởng vượt bậc, nhảy chỉ số mạnh | |
| jump | jump | nhảy, bật lên. | Tăng trưởng vượt bậc, nhảy chỉ số mạnh | |
| Xu hướng giảm | decrease | decrease | giảm, giảm bớt | sự giảm dần hoặc giảm xuống theo thời gian |
| fall/fall down | fall | rơi, giảm | sự giảm xuống đột ngột hoặc thay đổi mạnh | |
| go down | downward trend | đi xuống, giảm xuống | giảm theo mức độ hoặc sự thay đổi dần dần | |
| reduce | reduction | giảm bớt, làm giảm | giảm xuống một mức nào đó (có thể có chủ đích) | |
| decline | decline | suy giảm | suy giảm dần dần hoặc mất đi | |
| drop | drop | rơi, giảm xuống | thường là giảm mạnh hoặc đột ngột | |
| Xu hướng giảm mạnh | plunge | plunge | lao xuống, giảm mạnh, rơi nhanh | sự giảm đột ngột, mạnh mẽ hoặc sự di chuyển xuống nhanh chóng |
| slump | slump | suy giảm, giảm mạnh | sự suy thoái, giảm dần hoặc hạ thấp về mặt giá trị, năng suất. | |
| dive | dive | giảm mạnh, lao xuống | chỉ sự giảm nhanh, đột ngột trong giá trị hoặc tình huống | |
| plummet | plummet |
rơi thẳng xuống, giảm nhanh. |
miêu tả sự giảm đột ngột hoặc rơi nhanh và mạnh | |
| dip | dip | chìm xuống, giảm nhẹ | miêu tả sự giảm nhẹ, tạm thời, không quá đột ngột như các từ trên | |
|
Xu hướng tăng giảm bất thường |
fluctuate | fluctuation | dao động, biến động | đặc biệt là thay đổi liên tục và không ổn định giữa các mức độ cao và thấp |
| oscillate | oscillation | dao động qua lại | đặc biệt là di chuyển qua lại hoặc thay đổi giữa hai cực (thường theo chu kỳ hoặc đều đặn) | |
| wave | dao động | thường dùng trong bối cảnh sóng hoặc chuyển động không đều | ||
| vary | variation | thay đổi, khác nhau | chỉ sự khác biệt hoặc sự biến đổi từ một mức độ, trạng thái, hoặc dạng này sang một dạng khác | |
| Xu hướng ổn định | remain/stay stable | stability | vẫn ổn định, không thay đổi | đặc biệt là trong tình huống hoặc điều kiện nào đó |
| remain/stay unchanged | unchangeability | vẫn không thay đổi, không có sự thay đổi về bất kỳ khía cạnh nào | ||
| stabilize | stabilization | làm ổn định, duy trì sự ổn định sau khi đã có sự thay đổi hoặc dao động. | ||
| to be unchanged | vẫn không thay đổi, không có sự biến động hay thay đổi | |||
| Đạt mức cao nhất | reach a peak | đạt đỉnh điểm, lên tới đỉnh cao | ||
| reach/hit the highest point | đạt điểm cao nhất, lên tới mức cao nhất | |||
| Đạt mức thấp nhất | reach/hit the lowest point | đạt điểm thấp nhất, xuống mức thấp nhất | ||
| fall to a low | giảm xuống mức thấp hơn | |||
| each a bottom | đạt đáy, xuống tới mức thấp nhất | |||
Use of prepositions
- N + OF/ TO
- V + BY/ TO/ AT
- FROM - TO
* To: to a change to an exact point
* By/Of: the amount of change between two points
* At: describe a state (not movement)
* In + Noun (NOT figure)
Structures to describe trends
Một số cấu trúc cơ bản để diễn tả xu hướng:
- X + V + adv + giới từ + số liệu + time
The number of male employees fell dramatically to 100 in 2016.
Số lượng nhân viên nam giảm nhanh đáng kể xuống còn 100 người trong năm 2016.
- There be + a/an + adj + N + giới từ + số liệu + in + chủ thể + time
There was a sharp increase of 200 in the figure for female employees in 2015.
Có một sự tăng mạnh thêm 200 người trong số lượng nhân viên nữ năm 2015.
- X + saw + a + adj +N + time
The number of female workers saw a sharp decrease to 300 in 2018.
Số lượng nhân viên nữ chứng kiến một xu hướng giảm xuống 300 vào năm 2018.
- A + adj +N + was seen + in + chủ thể + time
A significant drop was seen in the number of obese people in 2021
Một xu hướng giảm mạnh được chứng kiển ở số lượng người béo phì vào năm 2021
- Year + witnessed/saw + a/an + adj + N + giới từ + số liệu + in + chủ thể
2018 witnessed a considerable increase of 300 in the number of female employees.
Năm 2018 chứng kiến một sự tăng rõ rệt thêm 300 người trong số lượng nhân viên nữ.
Phân tích viết bài chi tiết
Cấu trúc viết bài Line Graph mà bạn có thể viết để đảm bảo tính logic, mạch lạc, viết ban đầu hay hơn là phân chia:
- Introduction: 1 sentence. Ở mở đầu bạn có thể paraphrase lại câu hỏi
- Overview: 1-2 sentences. Phần này nêu tổng quan, phân tích chung overview
- Body paragraph 1: 3-4 sentences. Ở body, thực hiện phân tích report data, describe trends/changes, make comparisons
- Body paragraph 2: 3-4 sentences. Tương tự thực hiện phân tích report data, describe trends/changes, make comparisons
- Conclusion (nếu muốn): 1 sentence. Viết câu kết luận, tổng kết.
Chúng ta cùng phân tích một đề bài và bắt đầu với các mục để viết Linegraph nhé.
|
The graph below shows population figures for India and China since the year 2000 and predicted population growth up until 2050. Summarise the information by selecting and reporting the main features, and make comparisons where relevant. Write at least 150 words
|
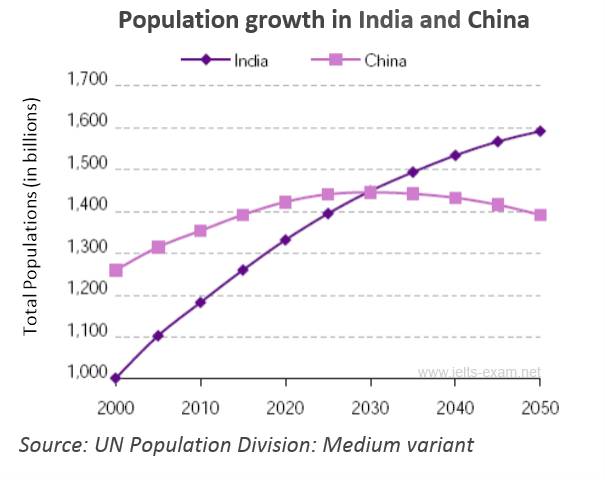
Introduction:
- Câu đề bài: The graph below shows population figures for India and China since the year 2000 and predicted population growth up until 2050
- Paraphrase:
The graph -> The line graph
shows -> expresses/illustrates/provides information about
Overview:
Trong vòng 50 năm từ năm 2000, dân số Ấn Độ sẽ tăng nhanh và vượt qua dân số Trung Quốc.
Over the 50-year period, India is going to experience steady growth in its population and it will overtake China.
Body:
Với loại biểu đồ này các bạn có thể chia phần Body làm 2 đoạn:
Đoạn 1: Miêu tả theo giai đoạn thời gian từ điểm bắt đầu (năm 2000) đến thời điểm hiện tại
- Trong năm 2000, số lượng người ở Trung Quốc nhiều hơn số người sống tại Ấn Độ
Cách viết:
|
In + year, there + tobe + so sánh hơn + than |
In 2000, there were more people living in China than in India. |
|
Mệnh đề compared to/ with/ in comparison with + cụm N |
In 2000, China’s population was much higher in comparison with India’s population. |
- Trong khoảng thời gian từ năm 2000 đến hiện tại, dân số Ấn Độ tăng 0.2 tỉ người trong khi dân số Trung Quốc tăng 0.1 tỉ người, nâng tổng dân số tại đây lên 1.35 tỉ.
Cách viết:
|
Trong khoảng thời gian từ năm 2000 đến hiện tại |
From 2000 to the present Between 2000 and the present In the period between 2000 and 2020 During the time from 2000 to 2020 |
|
S + V + adv |
The number of Indian citizens has gone up significantly. |
|
There + tobe + a + số liệu + N
There + tobe + a adj N |
There has been a 0.2 billion rise in the number of Indian citizens. There has been a dramatic increase in the India’s population. |
|
N + witnessed/ experienced/ saw + a adj N |
The population of India witnessed a sharp growth. |
|
Đồng thời |
At the same time Over the same period While/ Meanwhile |
Đoạn 2: Miêu tả từ thời điểm hiện tại đến điểm kết thúc (năm 2050)
- Dân số ở Ấn Độ sẽ tăng nhanh hơn dân số Trung Quốc
Cách viết:
|
S + will + V + adv
S + tobe + expected/ anticipated/ forecasted to + V + adv |
The population in India will increase more quickly than in China. The population in India is expected to raise more quickly than in China. |
- Vào năm 2030, dân số Trung Quốc và Ấn Độ sẽ đều là 1.45 tỉ dân
- By 2030, both countries will have the same population at 1.45 billion.
- Dân số Trung Quốc chạm đỉnh vào năm 2030 và sẽ giảm nhẹ xuống 1.4 tỉ dân vào năm 2050. Trong khi đó, dân số Ấn Độ tăng dần đều và đạt đỉnh 1.6 tỉ dân vào năm 2050.
Cách viết:
|
Đạt đỉnh |
reach a peak hit/touch the highest point |
- The population of China hit the highest point in 2030, and then fell slightly to 1.4 billion in the next 20 years. Meanwhile, the number of Indian citizens increased moderately, followed by the highest point by 2050.
Bài mẫu:
|
The graph shows how the population of India and China have changed since 2000 and how they will change in the future. Overall, over the 50-year period, India is going to experience steady growth in its population and it will overtake China. In 2000, there were more people living in China than in India. The number of Chinese was 1.25 billion, while India's population was about 1 billion. Between 2000 and the present, there has been a 0.2 billion rise in the number of Indian citizens. Over the same period, China's population has increased by 0.1 billion to reach over 1.35 billion. According to the graph, the population in India will increase more quickly than in China, and experts say that by 2030, both countries will have the same population of 1.45 billion. After this, China's population is likely to fall slightly to 1.4 billion in 2050, while India's population will probably increase and reach 1.6 billion. |
Phân tích luyện tập cách viết Linegraph
Video chữa đề 02 từ dự án chấm bài miễn phí của Ms Vân cũng là dạng Line Graph, các bạn theo dõi nhé:
Structure cấu trúc của một bài viết Task 1 với 4 đoạn, mở đầu, 2 đoạn giữa và kết thúc.
Video bài học 1
Step 1: Bắt đầu phân tích
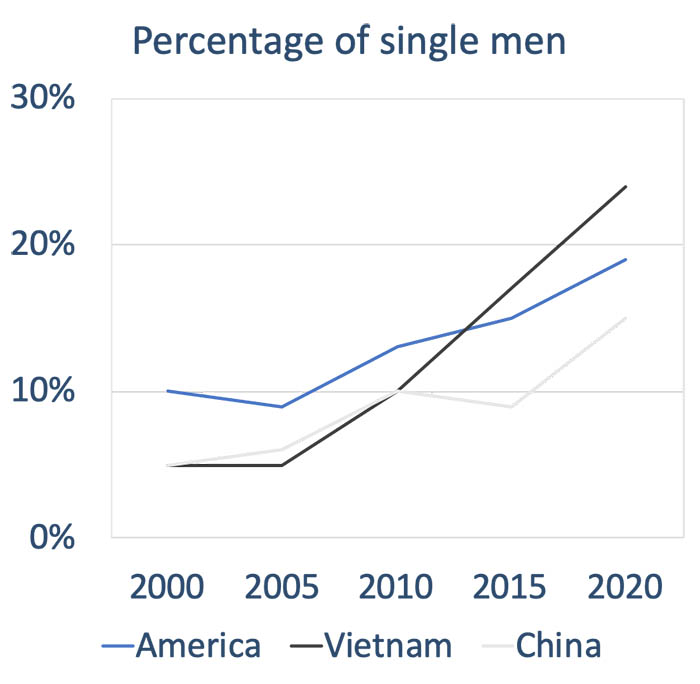
The graph shows the percentage of single men in America, Vietnam, China from 2000 to 2020.
Bạn phân tích:
Đối tượng là?
Trục Ox?
Trục Oy?
Step 2:
Sau đó ta có phân tích và paraphrase:
The graph shows the percentage of single men in America, Vietnam, China from 2000 to 2020.
in _____ of ________________________ (Oy)The graph ___________ /kəmˈperz/ ______________________ (đối tượng)
over a _________ period, ______________ (start) from
Introduction:
The given line graph compares ______________________ in terms of _______________________________ over ________________________________
Step 3:

✓
- Hai đường có xu hướng tăng, giảm, hay dao động?
→
✓
- Đường nào lớn hơn?
→
|
__________ /ˌəʊvərˈɔːl/, it can (see) that both rates exp_r_enced a __________-ward trend during the period from 1920 to 2000. We can also see that although the two trends were similar in terms of __________ /dɪˈklaɪn/, the birth rate of the USA in most years was __________than that of China. |
Video bài học 2
Step 1:
Chúng ta phân tích:
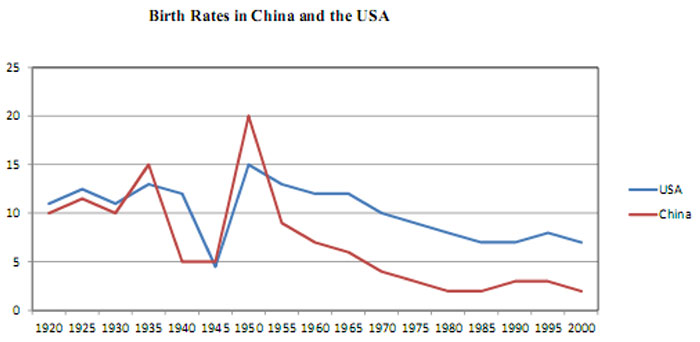
Body 1: China
+ 1920 – 1935:
+ 1940 – 1945:
+ 1950:
+ 1955:
+ 1980-2000:
Body 1
China’s birth rate ……………. from around 10 percent in the 1920s to 15 percent in 1935. Then it fell ……………. to around 5 percent in both 1940 and 1945. It ……………. rapidly to a ……………. of 20 percent in 1950. After this it fell ……………. to less than 10 percent in 1955. Finally, it ……………. ……………. to about 2 percent in 1980 and remained at this level until 2000.
Step 2: Phân tích để có body 2:
- Body 2: USA
+ 1920 – 1940:
+ 1945:
+ 1950:
+ 1960s:
+ 1980 - 2000:
Body 2:
Meanwhile, the US birth rate ……………. at around 12 percent from 1920 to 1940. It ………………. dramatically to under 5 percent in 1945. Next it …………….rapidly to a peak of about 15 percent in 1950. After 1950, it …………….gradually to about 12 percent in the 1960s and around 7 or 8 percent during the last 20 years of this period.
The line graph below shows the percentage of tourists to Scotland who visited four different attractions in Edinburgh
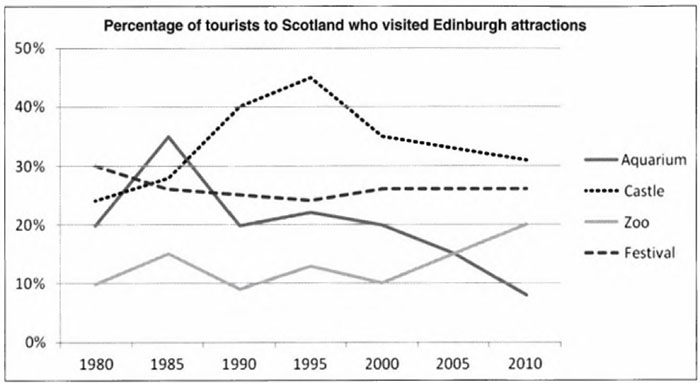
Step 1:
|
The line graph below shows the percentage of tourists to Scotland who visited four different attractions in Edinburgh. |
→The ……………. line graph ……………………. the percentage of ……………. to certain places in Scotland namely Aquarium, Castle, Zoo and Festival from 1980 to 2010.
Step 2:
✓ Hai đường có xu hướng tăng, giảm, hay dao động?
→
✓ Đường nào lớn hơn?
→
|
It is clear that while the percentage of tourists visiting Castle and Zoo ……………………. , the opposite was true for Aquarium and Festival over the period shown. It is also ……………………. that Castle was the most popular tourist attraction in Scotland for most of the period. |
Step 3:
Body 1:
→ In 1980, the percentage of visitors to Castle, which ……………………. at approximately 25%, was 2.5 times ……………………. than that to Zoo. During the period between 1980s and 1990s, the proportion of tourists visiting Castle increased dramatically and ……………………. a peak of 45% in 1995, before ……………………. declining to 30% in 2010. By contrast, before experiencing a rapid rise to 20% in the last year, the percentage of people visiting Zoo ……………………. around 10% from 1980 to 2000.
Body 2:
→In ……………………. of other places, in 1980, while there were 20% visitors to Aquarium, the figure for Festival stood at 30%. The period from 1980 to 1985 ……………………. a rapid rise in visitors to Aquarium to 35% and then the percentage steadily ……………………. to 10% in 2010. Meanwhile, the ……………………. of tourist who visited Festival fluctuated slightly but in general decreased moderately to 25% at the end of the period.
Phân tích bài mẫu
Bài mẫu 1
The given graph shows the past and projected figures of the government spending as a percentage of GDP for the years 2000 to 2025 in three areas. Summarise the information by selecting and reporting the main features and make comparisons where relevant.
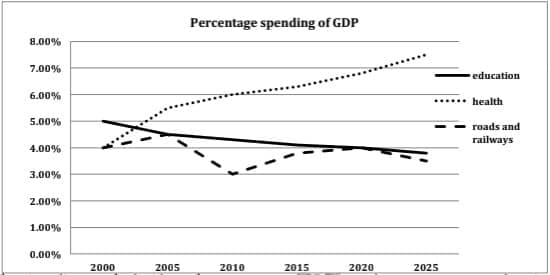
Brainstorming
Đây là đề bài rất dễ và quen thuộc về mặt hình vẽ. Trong 3 đường của line graph, chúng ta thấy rõ education có xu hướng giảm đều, health có xu hướng tăng mạnh rõ rệt, còn roads and railways thì có rất nhiều fluctuations. Đây sẽ là các ý nhận xét trong phần overview.
Về cách chia thông tin cho 2 đoạn thân bài thì theo kinh nghiệm thực tế của thầy, dữ liệu của education và health sẽ tốn ít câu chữ hơn và có thể được ghép vào trong cùng 1 đoạn body 1. Còn việc trình bày từng sự tăng giảm của roads and railways sẽ tốn nhiều câu chữ hơn, do vậy chúng ta sẽ để nó trong đoạn body 2.
Cuối cùng, điểm khó nhất của bài này chính là vấn đề thì của động từ. Một số bạn sẽ không đọc kỹ đề bài và bỏ quên mất chi tiết này: các câu văn mô tả thông tin của năm 2025 cần phải chia thì tương lai, hoặc là sử dụng các cấu trúc thể hiện sự dự đoán. Còn với các năm từ 2020 trở về trước thì cần sử dụng thì quá khứ. Ngoài ra, một số câu văn cần dùng cả thì hiện tại hoàn thành tiếp diễn.
Sample answer
The provided line graph illustrates how a country has been using its government budget and some future predictions in a period from 2000 to 2025.
At first glance, it is apparent that public spending on education has been experiencing a significant decline, while the reverse is true for that of healthcare. The figure for traffic infrastructure, meanwhile, has always been fluctuating.
Specifically, the percentage of GDP allocated to education dropped from the highest point of 5% in 2000 to 4% in 2020. It is predicted that this figure will keep falling in the next 5 years. On the other hand, a steady increase was seen in public spending on healthcare, from 4% in 2000 to 7% in 2020, and in 2025, this figure is forecast to reach 7.5 %.
Regarding traffic infrastructure, the proportion of GPD which is spent on roads and railways increased slightly by 0.5% from 2000 to 2005 before falling to the lowest point of 3% in 2010. The next decade witnessed a gradual rebound to 4%, but it is anticipated that this figure will decrease to 3.5% in 2025. (183 words, band 7.0)
Grammar and vocabulary highlights
Dưới đây là một vài cấu trúc ngữ pháp và từ vựng đã sử dụng trong bài để paraphrase, mọi người lưu ý nhé:
- allocate (v) money/resources to sth: phân bổ tiền/tài nguyên vào việc gì
- it is predicted that + clause/ this figure is forecast to V/ it is anticipated that + clause: 3 cấu trúc thể hiện sự đự đoán về tương lai
- public spending (n): chi tiêu công, tức là việc chi tiêu từ nguồn tiền ngân sách
- rebound (n): 1 sự tăng trở lại sau khi đã giảm trước đó
- the reverse (n): điều ngược lại, dùng từ này để đỡ phải paraphrase ngược lại câu văn trước
- traffic infrastructure (n): hạ tầng giao thông
Bài 2
The line graph shows the employment rate in four different industries from 1990 to 2025.
Summarise the information by selecting and reporting the main features, and make comparisons where relevant.
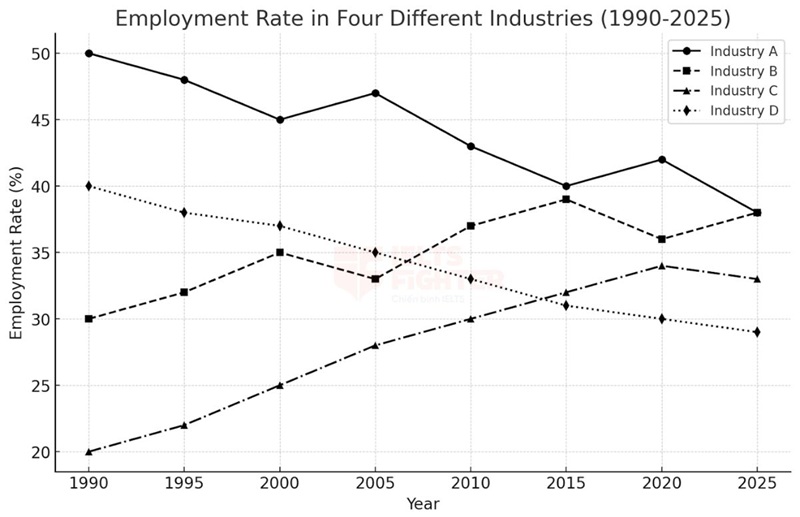
Outline
|
Introduction |
The line graph illustrates the percentage of people employed in four different industries—Industry A, Industry B, Industry C, and Industry D—between 1990 and 2025. Biểu đồ đường minh họa tỷ lệ lao động làm việc trong bốn ngành công nghiệp khác nhau—Ngành A, Ngành B, Ngành C, và Ngành D—trong giai đoạn từ năm 1990 đến năm 2025. |
|
Overview |
Employment trends in all four industries fluctuated over time, with several intersections between them. Tỷ lệ việc làm trong cả bốn ngành có sự dao động theo thời gian, với nhiều điểm giao cắt giữa các ngành. |
|
Body Paragraph 1 |
Describe the overall decline in Industry A and Industry D, and their points of intersection with other industries. Mô tả xu hướng giảm chung của Ngành A và Ngành D, và những điểm giao cắt của chúng với các ngành khác. |
|
Body Paragraph 2 |
Explain the increase in Industry B and Industry C, highlighting the fluctuations and key intersections. Giải thích sự tăng trưởng của Ngành B và Ngành C, nhấn mạnh các điểm giao nhau và những biến động chính. |
Sample Essay
The line graph illustrates the employment rate in four different industries—Industry A, Industry B, Industry C, and Industry D—between 1990 and 2025.
Overall, employment rates in all four industries fluctuated significantly over time, with multiple intersections. Industry A and Industry D showed a downward trend, whereas Industry B and Industry C experienced steady growth.
In 1990, Industry A had the highest employment rate at 50%, but this figure gradually declined to 38% by 2025, despite minor recoveries around 2000 and 2015. Industry D followed a similar trend, starting at 40% and dropping consistently to 29% in 2025. Notably, Industry A and Industry B intersected in 2010, while Industry D and Industry C had similar employment rates around 2020.
On the other hand, Industry B and Industry C exhibited an upward trend. Industry B grew from 30% in 1990 to a peak of 39% in 2020 before stabilizing at 38% in 2025. Similarly, Industry C increased from 20% in 1990 to 34% in 2020, experiencing steady growth. The frequent intersections among the four industries indicate shifts in employment trends over time.
Biểu đồ đường minh họa tỷ lệ việc làm trong bốn ngành công nghiệp khác nhau từ năm 1990 đến năm 2025.
Nhìn chung, tỷ lệ lao động trong cả bốn ngành có sự dao động đáng kể theo thời gian, với nhiều điểm giao nhau. Ngành A và Ngành D có xu hướng giảm, trong khi Ngành B và Ngành C có sự tăng trưởng ổn định.
Năm 1990, Ngành A có tỷ lệ việc làm cao nhất, ở mức 50%, nhưng con số này giảm dần xuống còn 38% vào năm 2025, dù có sự phục hồi nhẹ vào khoảng năm 2000 và 2015. Ngành D cũng có xu hướng giảm tương tự, từ 40% xuống còn 29% vào năm 2025. Đáng chú ý, Ngành A và Ngành B giao nhau vào khoảng năm 2010, trong khi Ngành D và Ngành C có tỷ lệ tương đồng vào khoảng năm 2020.
Ngược lại, Ngành B và Ngành C có xu hướng tăng lên. Ngành B tăng từ 30% năm 1990 lên mức cao nhất 39% vào năm 2020 trước khi ổn định ở mức 38% vào năm 2025. Tương tự, Ngành C tăng từ 20% vào năm 1990 lên 34% vào năm 2020, cho thấy sự phát triển liên tục. Những giao điểm thường xuyên giữa các ngành này phản ánh sự thay đổi linh hoạt trong thị trường lao động theo thời gian.
Uncommon Words and Collocations
- Employment trends(/ɪmˈplɔɪmənt trɛndz/, noun phrase): Xu hướng việc làm
- Frequent intersections(/ˈfriːkwənt ˌɪntərˈsɛkʃənz/, noun phrase): Các điểm giao nhau thường xuyên
- Downward trend(/ˈdaʊnwərd trɛnd/, noun phrase): Xu hướng giảm
- Steady growth(/ˈstɛdi ɡroʊθ/, noun phrase): Sự tăng trưởng ổn định
- Shifts in employment(/ʃɪfts ɪn ɪmˈplɔɪmənt/, noun phrase): Sự thay đổi trong xu hướng việc làm
Các bạn cùng xem hết video và luyện tập nha!
Mở rộng thêm Tổng hợp 10+ bài mẫu IELTS Writing Task 1 Line Graph hay