IELTS Writing Task 1 dạng bài Mixed chart, Multiple Charts
Ngoài những đề bài Map, Process quen thuộc khó nhằn thì IELTS Writing Task 1 còn có Mixed chart thường làm khó các thí sinh. Vậy làm thế nào để viết dạng bài này? Cùng tìm hiểu nhé!
Writing Task 1 Mixed Chart ví dụ
Multiple Charts/Graph (Mixed Charts) là biểu đồ kết hợp được nhiều thí sinh nhận xét khó nhất khi làm Task 1. Dạng bài này sẽ ghép 2 hoặc nhiều chart với nhau (có thể chart giống hoặc khác). Để làm tốt dạng bài này thì thí sinh cần chắt lọc thông tin, phân tích so sách giữa số liệu, sự giống và khác nhau của hai biểu đồ được cho.
Với lượng thông tin từ hai biểu đồ, thí sinh thường thấy khó phân tích tuy nhiên nếu chọn lọc thông tin tương đồng, phân tích so sánh nắm được thông tin chính sẽ giúp bạn làm bài dễ dàng hơn.
Các dạng đề Mixed Charts thường gặp:
- Các dạng bài Mixed Charts thường gặp
- Table (bảng biểu) với pie chart (biểu đồ tròn)
- Table (bảng biểu) với line chart (biểu đồ đường)
- Table (bảng biểu) với bar chart (biểu đồ cột)
- Pie chart (biểu đồ tròn) với line chart (biểu đồ đường)
- Pie chart (biểu đồ tròn) với bar chart (biểu đồ cột)
- Line chart (biểu đồ đường) với bar chart (biểu đồ cột)
Needed information:
- Paraphrase the question
- Useful structure:
The bar/ line chart + illustrates/ gives information about/ shows/ depicts + (graph 1) + while/and + the table/picture provides information about/describes/compares + (graph 2).
Cách viết Writing Mixed Chart
Bạn cùng xem video để phân tích chi tiết dạng bài này và từng bước viết bài nhé:
Bài học chia theo 3 phần: Material - Strategy - Practice. Cô Dương giới thiệu các từ vựng, cấu trúc cần thiết trước khi phân tích chiến thuật viết bài và luyện tập ứng dụng theo đề thi thật cho bạn.
Material
1. Language for describing statistics
Activity 1. Look at the dynamic pie charts below and complete the body paragraphs with the correct words in the box.
In 2000, the (1) .................... of household spending was on accommodation, which made up 30% of total expenses. Food and transportation followed closely behind, at 25% and 20% respectively. Leisure activities only (2) .......................... a small (3) ...................., at just 10%.
By 2020, there were notable shifts. Accommodation expenses still (4) .................... a significant share at 28%, although spending on transportation rose to 25%, (5) .................... one quarter of the overall expenditure.
Activity 2. Find and correct a mistake in each sentence.
1. The percentage of the Japanese market accounts for 35% of the company's revenue.
=>
2.The number of students reading books in Vietnam in 2010 was 1500, while the figure for the number of students in Thailand was 2000.
=>
3. The regular smokers is highest, which comprises 35% of all types of smokers.
=>
4. There were no changes in the amount of people aged 0-14, which remained at 15%.
=>
Strategy
1. Introduction
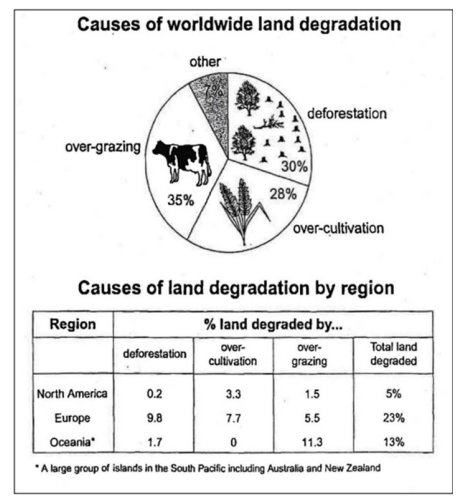
The pie chart below shows the main reasons why agricultural land becomes less productive. The table shows how these causes affected three regions of the world.
Activity 3 . Choose the best introduction.
A. The pie chart illustrates the major causes of global land degradation.
B.The charts describe the reasons why agricultural land becomes less productive and how the causes affected three regions of the world.
C. The pie chart displays the major causes of global land degradation, while the table illustrates how three regions of the world were affected by these causes during the 1990s.
|
Needed information:
The bar/ line chart + illustrates/ gives information about/ shows/ depicts + (graph 1) + while/and + the table/picture provides information about/describes/compares + (graph 2). |
2. Overview
Activity 4. Fill in the blanks with the correct information
The __________________ accounts for the largest proportion of land erosion.
The land degradation in ___________ is far higher than that in in other two areas.
|
Needed information: • Main features of each graph: + Static graph: Order (Highest/ Lowest) + Dynamic graph: Trend (Upward, downward) + Order (Highest/ Lowest) |
3. Body
Activity 5. What are the main features in each chart?
Body paragraph 1:
+ Over a third – 35% of the land worldwide – degraded by having too many animals feeding on it higher than – deforestation & crop production – 30% & 28%
+ Other causes – make up only 7% - a tiny minority
Body paragraph 2:
+ Europe – where land degradation – the most alarming – nearly a quarter 10% higher than – Oceanian islands & nearly 5 times higher than – North American regions
+ Deforestation: Europe tops – almost one tenth
+ Over-grazing: damages just under 12% - Oceania – higher than other figures in the same column
+ North America – 3.3% of land degraded by over cultivation – more than double - overgrazing
|
Important notes:
|
Practice
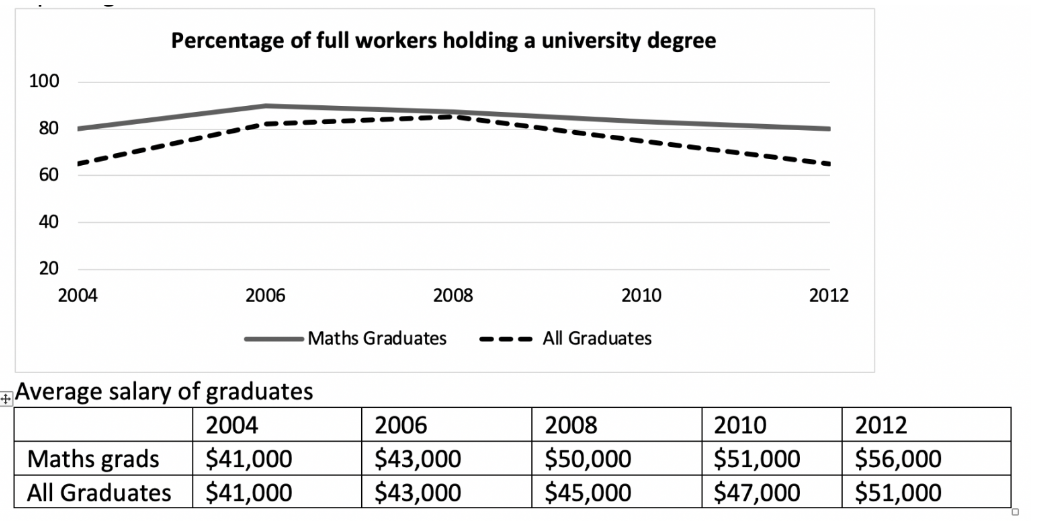
The graphs below show the percentage of graduates that got full-time jobs after graduating from a university in Australia, and the average salary of both these types of graduates, from 2004 to 2012. Summarise the information by selecting and reporting the main features, and make comparisons where relevant.
OUTLINE
Overview:
Body paragraph 1:
Body paragraph 2:
Luyện tập Writing Mixed Chart
Ta có ví dụ dưới đây:
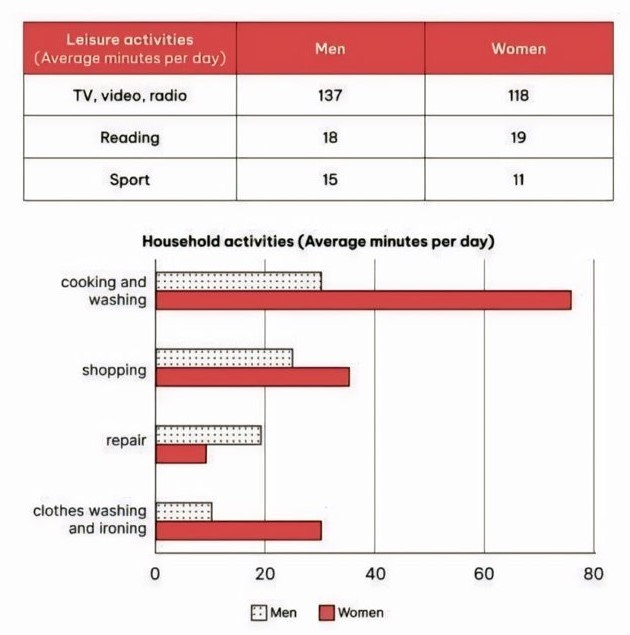
The charts below show the comparison of time spent, in minutes per day, by UK males and females on household and leisure activities in 2008.
Summarise the information by selecting and reporting the main features, and make comparisons where relevant.
1. Phân tích bài 1
Đề bài phía trên nhé: The charts below show the comparison of time spent, in minutes per day, by UK males and females on household and leisure activities in 2008.
Summarise the information by selecting and reporting the main features, and make comparisons where relevant.
Hướng dẫn viết bài
INTRODUCTION
Paraphrase:
The charts below => The table and bar chart
show the comparison of => compare
time spent, in minutes per day, …..on household and leisure activities => average time spent on pastimes and housework
by UK males and females => men and women in the UK
➤ The table and bar chart compare men and women in the UK regarding their average time spent on pastimes and housework in 2008.
OVERVIEW
leisure: TV, video, radio - most popular; housework: cooking and washing - most time-consuming
men: more time on leisure activities >< women: allocated more time on household chores
➤ Overall, it is noticeable that for both genders, TV, video, and radio were the most favored leisure activities while cooking and washing were the most time-consuming household tasks. Moreover, men generally spent more time on entertainment, whereas women dedicated considerably more time to housework.
BODY 1: leisure activities
TV, video, radio: favored by both genders, men allocating 137 mins/day, women 118 mins/day
Sports: men engaged in sports more, 15 mins compared to 11 mins of women
Reading: nearly comparable - 18 and 19 mins
➤ Looking first at freetime activities, both genders favored watching TV, videos, and listening to the radio, with men spending 137 minutes per day and women 118 minutes per day on these activities. Males also engaged in sports more, at 15 minutes daily compared to 11 minutes of their female counterparts. However, for reading, the time allocated among both males and females was nearly comparable at 18 and 19 minutes, respectively.
engaged in /ɪnˈɡeɪdʒd ɪn/ tham gia vào
counterparts /ˈkaʊntərˌpɑrts/ đối tác
the time allocated /ðə taɪm ˈæləˌkeɪtɪd/ thời gian phân bổ
nearly comparable /ˈnɪrli ˈkɑmpərəbəl/ gần như tương đương
BODY 2: housework
cooking & washing: women spent the greatest amount of time - 75 mins, twice as much as men's
shopping: second most time-intensive activity - 25 and 35 mins
clothes washing + ironing: share the same pattern
repair: the only household chore that men >> women
➤ Regarding housework, women dedicated the greatest amount of time on cooking and washing dishes, at 75 minutes per day, which was double men's figure. Shopping was the second most time-intensive task, with the numbers being 25 minutes for males and 35 minutes for the other gender. The same pattern, but to a greater extent, can be witnessed in the figures of clothes washing and ironing, which tooks housewives 30 minutes on a typical day, triple that of their husbands. Conversely, repairing was the only household chore that men spent more time than women, averaging nearly 20 minutes compared to 9 minutes.
double /ˈdʌbəl/ gấp đôi
time-intensive task /taɪm ɪnˈtɛnsɪv tæsk/ công việc tốn nhiều thời gian
triple /ˈtrɪpəl/ gấp ba
Conversely /kənˈvɜrsli/ ngược lại
➤ BÀI MẪU
The table and bar chart compare men and women in the UK regarding their average time spent on pastimes and housework in 2008.
Overall, it is noticeable that for both genders, TV, video, and radio were the most favored leisure activities while cooking and washing were the most time-consuming household tasks. Moreover, men generally spent more time on entertainment, whereas women dedicated considerably more time to housework.
Looking first at freetime activities, both genders favored watching TV, videos, and listening to the radio, with men spending 137 minutes per day and women 118 minutes per day on these activities. Males also engaged in sports more, at 15 minutes daily compared to 11 minutes of their female counterparts. However, for reading, the time allocated among both males and females was nearly comparable at 18 and 19 minutes, respectively.
Regarding housework, women dedicated the greatest amount of time on cooking and washing dishes, at 75 minutes per day, which was double men's figure. Shopping was the second most time-intensive task, with the numbers being 25 minutes for males and 35 minutes for the other gender. The same pattern, but to a greater extent, can be witnessed in the figures of clothes washing and ironing, which tooks housewives 30 minutes on a typical day, triple that of their husbands. Conversely, repairing was the only household chore that men spent more time than women, averaging nearly 20 minutes compared to 9 minutes.
2. Phân tích bài 2
Write a report for a university lecturer describing the information below.
You should write at least 150 words
Với bài này chúng ta có thể phân chia bố cục như sau:
- Introduction and Overview
- Body 1: Miêu tả biểu đồ 1
- Body 2: Miêu tả biểu đồ 2
Bài mẫu
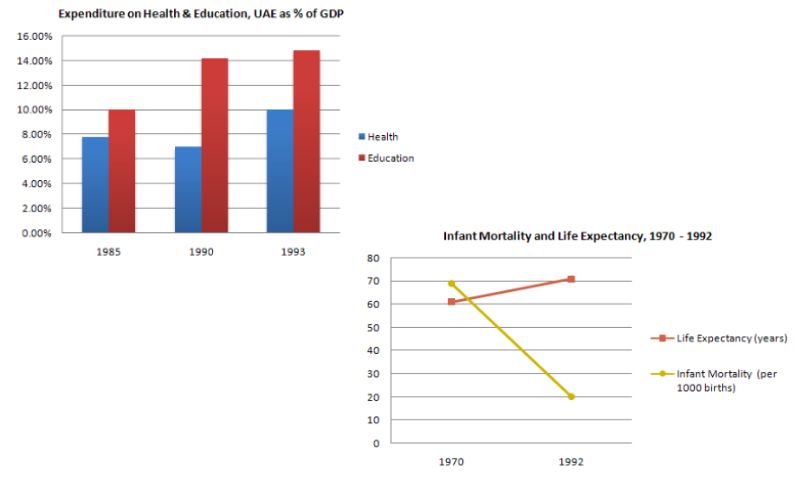
The graphs show health and education spending and changes in life expectancy and infant mortality in the UAE. Overall, as the percentage spent on health and education increases, infant mortality and life expectancy improve.
Graph 1 expresses the percentage of GDP spent on health and education between 1985 and 1993. There were big increases in both areas. In details, health spending stood at about 8% in 1985 but rose to 9% in 1990 and 10% in 1993. Besides, spending on education was even higher. It was 10% in 1985, and shot up to 14% in 1990 and 15% in 1993, a 50% increase in just 8 years.
Graph 2 demonstrates improvements in life expectancy and infant mortality between 1970 and 1992. Life expectancy was just 60 in 1970 but rose to almost 72 in 1992. In contrast, the number of babies dying dropped dramatically, from 60 per 1000 in 1970 to only 22 in 1992.
In conclusion, people in the UAE are living longer and healthier lives because of the government's spending on education and medical facilities.
Trên đây là bài học về hướng dẫn cách viết IELTS Writing Task 1 Mixed Chart. Bạn cùng luyện tập thêm để cải thiện kỹ năng nhé. Cùng mở rộng thêm với Bộ bài mẫu Task 1 Mixed Chart nhé!
Xem thêm: