Hướng dẫn cách viết IELTS Writing Task 1 Bar Chart
Bài học tiếp theo thuộc chuỗi Writing là các bạn cùng ôn luyện dạng bài Bar Chart trong IELTS Writing Task 1 nhé. Cùng phân tích cách viết bài Bar Chart ngay dưới đây nhé.
⇒ Để xem cách làm các dạng bài khác, bạn click xem tại: Hướng dẫn viết Writing Task 1 chi tiết
Cách viết dạng bài Barchart chi tiết
Bar chart - Biểu đồ cột dùng các ô cột đứng hoặc nang để thể hiện sự thay đổi của đối tượng theo đơn vị nhất định. Bài biểu đồ cột thường yêu cầu so sánh, phân tích về đặc điểm, số liệu và dự đoán xu hướng của đối tượng.
Có thể là:
- Vertical bar chart: cột đứng (phổ biến hơn)
- Horizontal bar chart: cột ngang
Các loại biểu đồ cột:
Có hai dạng Bar Chart là:
- Time graph/Dynamic charts: Biểu đồ có sự thay đổi theo thời gian
- Comparison graph/ Static charts: Biểu đồ không có sự thay đổi theo thời gian
MATERIAL
I. Phân biệt "percentage of" / "percent" / "the number of" / "the amount of"
1.Percentage/proportion of + N (danh từ không đếm được / N đếm đượcsố nhiều) → Tỷ lệ phần trăm của một nhóm
Ex. The percentage of students who passed the exam increased
2.Percent (%) → Dùng với số cụ thể, + “of” theo sau (nếu đóng vai trò là S)
Ex: Only 30 percent of employees work remotely.
3.The number of + N (danh từ đếm được số nhiều) → Số lượng (đếm được)
Ex: The number of tourists visiting the city has risen.
4.The amount of + N (danh từ không đếm được) → Lượng (không đếm được)
Ex: The amount of water consumed per day is increasing.
Activity 1. Translate these sentences
Lượng dầu khí được sản xuất ở Mỹ chiếm 20% tổng số lượng dầu trên toàn thế giới.
=>
2. Số lượng người sử dụng điện thoại thông minh để kết nối mạng chiếm 75% tổng số người sử dụng mạng ở quốc gia này.
=>
3. Tỷ lệ của khí thải carbon ở công ty A và công ty B lần lượt là 30% và 45%.
=>
II. Reduced relative clauses
Reduced relative clause is frequently used in IELTS Writing Task 1.
Reduced relative clauses are mainly created through the use of:
- Present participle phrases (V-ing)
- Past participle phrases (V_ed)
- Past Participles
- Prepositional Phrases
- Adjectives and adjective phrases
- If the verb is in the active voice, it gets reduced to a present participle phrase (V-ing)
- If the verb is in the passive voice, it gets reducted to a past participle phrase (V-ed)
Activity 2. Use reduced relative clauses in the following sentences.
1. The proportion of money which was spent on entertainment was 25%.
=>
2. The figure for students who applied for the scholarship witnessed an upward trend.
=>
3. The number of those who drove to work rose to 7 million.
=>
4. The amount of meat that was consumed by the British fell sharply.
=>
III. Cấu trúc After/Before
When the two clauses share the same subject, you can use the reduced adverb time clause.
Activity 3. Fill in the blanks
1. Before S+ V1, S+ V2 = Before V-ing, S+V2
Before the figure reached a peak of 200 in 2008, it dropped to 100 in 2006
=>
2. After S + V1, S + V2 = After V-ing, S+V2
After the number rose sharply to 100 in 2006, it hit the lowest point of 15 in 2010.
=>
STRATEGY
I. Dynamic charts
Overview
|
Needed information: (Dynamic chart) • Order (highest/lowest) • Trend (increase/decrease) Notes: Don’t report data or state your opinion |
Lead-in: The bar chart below illustrates the femake unemployment rates in the four countries of the UK in 2013 and 2014.
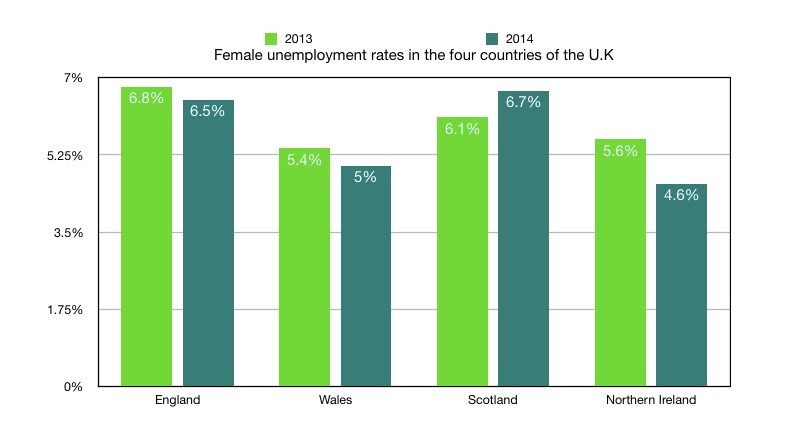
2. Sample Overview
Overall, there were fewer women without work in 2014 than in the previous year, except in Scotland. It is also noted that the unemployment rates for women in England and Scotland were significantly higher than those in Wales and Northern Ireland.
Body paragraphs could be divided based on the type of bar graph.
- Type 1 ( 2 points in time): Should be divided by period of time
+ Beginning – mid point: Report data + Trend/ Comparison
+ Mid point – End: Report data + Trend/ Comparison
- Type 2: Type 2 (more than 2 points in time): Should be divided by category
(Group categories with similarities (high/low, increased/ decreased,...)
Activity 4: Make a detailed outline for the bar chart in the lead-in
Body 1:
Body 2:
Activiy 5: Write a full body for the essay
=>....
II. Static charts
1, Overview
|
Needed information: (Static chart) •Order (comparison between labels) •Order(highest/lowest among categories) Notes: Don’t report data or state your opinion |
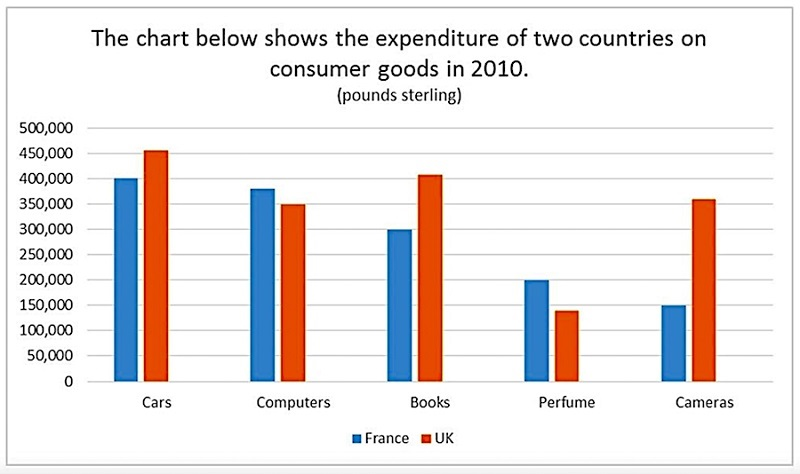
Activity 6: Write an overview for the above bar chart:
2, Body paragraphs
There are two approaches to dividing the body paragraphs of a static bar chart. It is advisable to divide by category.
By category (categories with similarities)
- Option 1: Similar patterns
Body 1: pattern 1 (ex: Label A higher than Label B)
Body 2: pattern 2 (ex: Label A lower than Label B)
- Option 2: Similar figures
- Option 3: Similar fields
Activity 7: Make a detailed outline for the above bar chart
Body 1:
Body 2:
Activity 8: Write a full body for this essay
=> ....
PRACTICE
The chart below shows numbers of incidents and injuries per 100 million passenger miles travelled (PMT) by transportation type in 2002.
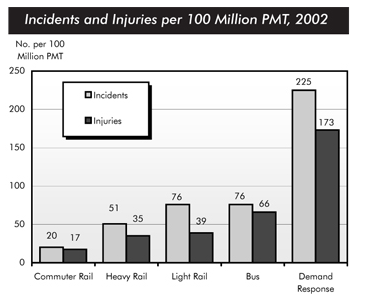
Overview:
Body 1:
Body 2:
Luyện tập dạng bài Barchart
Các bạn có thể xem thêm nhiều ở bài Tổng hợp bài mẫu Bar Chart nhé!
Ta luyện tập thêm theo bài mẫu bên dưới:
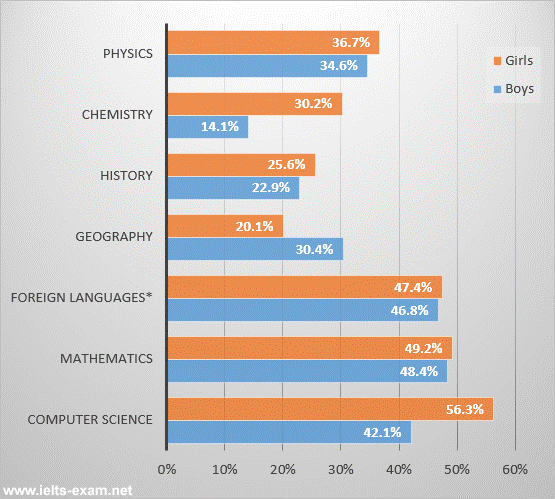
The bar chart below shows the percentage of students who passed their high school competency exams, by subject and gender, during the period 2010-2011.
Summarise the information by selecting and reporting the main features, and make comparisons where relevant.
Write at least 150 words.
Students passing high school competency exams, by subject and gender, 2010-2011
Introduction:
|
Đề bài |
Paraphrase |
|
|
The bar chart below shows the percentage of students who passed their high school competency exams, by subject and gender, during the period 2010-2011. |
1. shows
|
expresses/illustrates/provides information about
|
|
2. the percentage of students |
the proportion of students/ the number of students
|
|
|
3. passed
|
be successful in/ managed to finish
|
|
|
4. during the period 2010 – 2011 |
from 2010 to 2011 |
|
|
-> The bar charts provides the information about the number of students who were successful in their highschool competency exams in terms of subject and and gender, in the period from 2010 to 2011. |
||
Overview:
|
Ý tưởng |
Viết câu |
|
Con gái có kết quả học tập tốt hơn con trai trong hầu hết các môn học. |
In general, during the time from 2010 to 2011, girls performed better in most subjects in the competency exams than boys.
|
Body:
|
Đoạn |
Gợi ý |
Ý tưởng |
Viết câu |
|
1 |
Tập trung miêu tả các môn học mà tỉ lệ học sinh nam/nữ học tốt nhất là tương đương (Computer Science, Mathematics, and Foreign Languages) |
Học sinh ở cả hai giới đều học tốt nhất các môn như Khoa học Máy tính, Toán học và Ngoại ngữ |
Students in both sexes performed best in some subjects including Computer Science, Mathematics, and Foreign Languages. |
|
Kết quả học của nam và nữ trong các môn học Ngoại ngữ và Toán học là như nhau |
|
||
|
2 |
Miêu tả các môn học có sự khác biệt lớn về tỉ lệ đỗ của nam và nữ |
Tỉ lệ học sinh nữ đỗ nhiều nhất ở môn Khoa học máy tính (56.3%), cao hơn 14% so với tỉ lệ này ở học sinh nam (42.1%) |
|
|
Môn học có sự chênh lệch lớn nhất về tỉ lệ con gái đỗ nhiều hơn con trai là môn Hóa học (Chemistry), với tỉ lệ con gái nhiều hơn 16% |
The difference was greater in Chemistry, where 16% more girls pass in comparison with boys. |
||
|
Điểm đáng chú ý đó là Địa lí là ôn học duy nhất có tỉ lệ con trai đỗ nhiều hơn con gái |
A striking feature is that Geography was the only subject which boys’ results were better than girls, at 30.4% and 20.1% respectively. |
Cấu trúc:
|
A + to be the same as + B similar to |
The number of boys passing Foreign Languages and Mathematics was the same as the number of girls managing to finish these tests. |
|
A and B + to be + comparable equivalent equal the same |
Results for boys and girls were roughly the same |
|
..., at ...% and ...% respectively |
The percentage of girls passing Computer Science was higher than that of boys, at 56.3% and 42.1% respectively. |
|
S + tobe + the + adj-est (với tính từ ngắn) most adj (tính từ dài) |
The proportion of girls passing Computer Science was the highest rate compared to others. |
|
Điểm đáng chú ý |
Surprisingly, mệnh đề striking A(n) outstanding + feature is that + mệnh đề noticeable |
Bài mẫu:
The bar charts provide the information about the number of students who were successful in their highschool competency exams in terms of subject and and gender, in the period from 2010 to 2011. In general, girls performed better in most subjects in the competency exams than boys.
As can be seen, students of both sexes performed best in Computer Science, Mathematics, and Foreign Languages. Results for boys and girls were roughly the same in Computer Science and Mathematics. In other subjects, however, there were some significant differences.
Girls achieved by far their best results in Computer Science, with a pass rate of 56.3%, which was around 14% higher than the boys. The difference was even greater in Chemistry, where over than 16% more girls passed. The only subject where boys’ results were better than girls was Geography where they achieved a pass rate of 30.4%, which was 10% higher than the result for girls.
Các bạn cùng lưu về học nhé.
Bạn cùng luyện thêm các dạng bài: